Web Performance: Optimizing the Network Waterfall

Web performance is increasingly gaining attention in recent times, mainly because we are able to realize the impact of poor page load performance on business & customer experience [1]. Thanks to modern web browsers, tools & frameworks for their increased focus on performance [2]. We can also find a similar focus while developing newer features & products.
However, web performance is not something that we fix it once & forget about it forever. It is a continuous process! For example -
- Many of the optimization techniques (packaging js files into one single file, CSS sprites[3], etc.) that existed prior to HTTP2 are now either obsolete or questionable [4].
- Even browsers are trying to add support for newer performance optimization techniques (ex: starting Chrome 76 you’ll be able to use the new loading attribute to lazy-load resources without the need to write custom lazy-loading code [5]).
So having a process to measure, monitor & constantly improvise web page performance by leveraging on newer techniques & capabilities is the only way to deliver awesome customer experiences.
I will be sharing below some of the simple techniques which we applied & achieved up to ~30% improvement in page load times in some of our key workflows at Intuit (QuickBooks Online).
Understanding Performance Metrics
Identifying the performance bottleneck is like finding a needle in a haystack, especially when you don’t know the right metrics to look for. Statements like “I tested my app, and it loads in X.XX seconds” is not false, it's just that load times vary dramatically from user to user, depending on their device capabilities & network conditions. Hence, presenting load times as a single number ignores the users who experienced a much longer load time. So, we should always look at TP99, TP999, etc [1] to get a sense of how your application is performing in the field.
But how do we test in a pre-production environment and still ensure that the page is performant without releasing it to the customers (since TP99 is a metric from the field)? In order to solve this issue, we benchmark our pages with various network & CPU profiles using tools like Web Page Test [6] and use the same for verification before even releasing code changes to the production environment. You can also use developer tools from the Google Chrome browser [7] to simulate the same while testing it locally.

It is very critical to verify your changes with fast-3G & slow-3G network profile. I have seen developers often looking at the network/application logs fro production and say “our customer base is mostly 4G, why should I test it against fast-3G/slow-3G network profile?”. We had the exact same question in our minds when we got started initially, but as we learned more we realized that this browser metric “window.navigator.connection.effectiveType” is not 100% accurate, it is only a determined value based on how the network has behaved recently in the user's machine.

So, it is important to even solve for connections with high network latency (because it can happen even if you have a network connection with very good bandwidth). And if you solve for these outliers, you will be able to easily achieve a better page load performance (measured by TP99 metric).
Optimizing the Network Waterfall
Web page load performance optimization includes various techniques that can be categorized into the following areas. (I have deliberately tried to use a simpler terminology here.)
- Optimize/minimize resources sent over the network
• Eliminate unnecessary downloads
• Minify & compress (gzip/brotli [8]) resources to reduce download time
• Use CDN for static assets
• Prefetch, preload, preconnnect critical resources
• Delay loading non-critical resources
• Reduce the number of networks calls
• Image & Font optimization
• etc, - Optimize API calls
• Reduce time taken for API to respond
• Compress API response data to reduce download time
• etc, - Optimize UI rendering
• Patterns like PRPL [9], RAIL [10]can be helpful
• Reduce JS compile, parse, execute time
• etc,
As you can see this starts to become overwhelming for anyone to remember & apply these techniques. Another way to look at the same is to say “Optimize the network waterfall” (well! not everything is covered but most of it will be included in this). Why do we say so? We will learn more about this in the remainder of this section.
Network waterfall is a 2D visual representation of the sequence of network events happening over a timeline.
Below is the screenshot of the network panel (developer tools) from the Google Chrome browser, highlighting critical aspects used in optimizing web page performance.
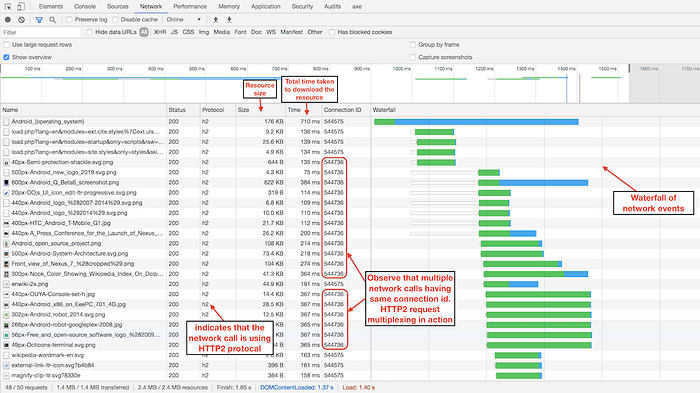
Let’s understand this better by looking at various hints from the network waterfall to see what are the opportunities for performance optimization & what will give you the maximum return of investment.
Reduce the number of steps in the network waterfall
The below diagram is a simple illustration of a typical network waterfall.
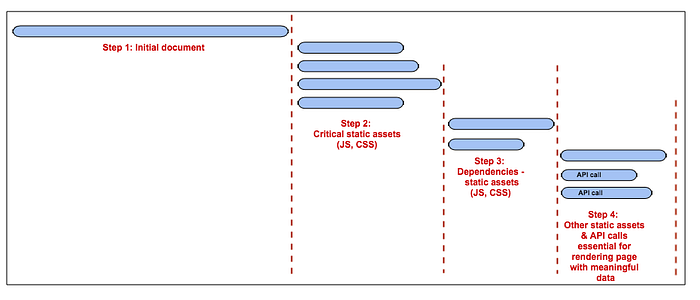
As you can see in the diagram, there are multiple steps in the network waterfall (which is perfectly ok!). Because we load the initial document/HTML, then start loading the critical assets, then the browser would know about the dependent assets and load the same, & then finally we start making API calls (which might be required to show meaningful data to the user). But until we show something meaningful on the page we can’t really say that the page has been successfully loaded. So, if we can reduce the number of steps in the network waterfall before the page is successfully loaded, we can achieve better page load performance.
Let's understand this better
- What is wrong with having multiple steps in the network waterfall?
- What do we mean by reducing the number of steps in the network waterfall?
One of the early thoughts we would get once we look at the network waterfall is “how can we reduce the transfer size of the resource?” (so that the resource loads faster). Well, this will definitely help in terms of performance, but not as much as reducing the number of steps in the network waterfall. Why is that, if you observe “step 2” in the diagram above there are multiple parallel calls being made. So, even if you reduce the transfer size of one of the resources you will still need to wait for all those parallel calls to be completed. So, essentially, the time taken by any “step” in the network waterfall is the time taken by the slowest network call. Also, the time taken to load a specific resource not only depends on the transfer size but also depends on the network latency.
Can we really say a file which is 1kb (in transfer size) always loads faster than a file which is 20kb? Not really!
So, instead of spending our effort to reduce the transfer size (which we will do as well), we should focus mostly on reducing the number of steps in the network waterfall to get a maximum performance improvement.
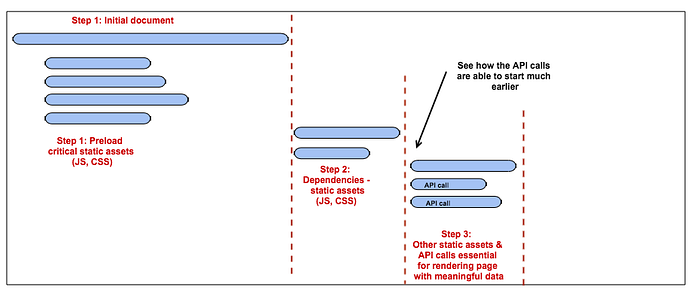
If you see in diagram 2, you can observe how preloading some of the critical assets has helped us reduce the number of steps in the network waterfall. And this is excellent because the browser is anyways idle while downloading the initial document! Also, HTTP2 preaches loading multiple smaller bundles in parallel than a single large bundle (Note: you need to be cautious about too many parallel requests as well). In the same lines, there are multiple other techniques that you could use to reduce the number of steps.
If I were to summarize some of the top techniques which can be used to reduce the number of steps in the network call (without getting into the details) here is what the list goes like.
- Eliminate/remove network calls that are not required. This is especially beneficial if you are able to eliminate all calls for a given step in the waterfall. But this is often tough because you have added the call since you believe it is important. I can share an instance on how we were able to eliminate a few network calls altogether. Instead of using CSS/SASS (which made additional calls due to the way we bundled our assets) when we started using styled-components to replace those styles defined in CSS/SASS we were able to eliminate that network call altogether.
- Lazy load non-critical assets (If option 1 is not possible). The idea is to delay loading non-critical assets so that we can get to start loading API calls at the earliest. At Intuit we use React JS in most of the web applications, so we found React.Lazy [11] working really well to lazy load some of the non-critical UI components (which be loaded either on demand when a user takes an action; or once the initial load is complete), and also reducing the bundle size of the critical/entry JS layers.
- Load assets in parallel as much as possible. Preload/prefetch can be used during the initial page load. But for subsequent navigations within a SPA (Single Page Application) preloading static assets along with the entry layer is critical. We applied this technique internally & found very promising results. Our technique could be specific to the UI framework which we are using. We have a homegrown micro-frontend-like framework that uses ReactJS, webpack, and more. And webpack loads the libraries that are defined as externals only after we load the initial entry layer. The optimization we did helped us load the entry layer and the dependencies in parallel reducing 1 additional step in the network waterfall. But you should be able to apply this concept in other frameworks as well.
- Reduce the time taken to complete a given step in the network waterfall. This approach involves reducing resource transfer size (eliminating unwanted code, code splitting, minification, gzip/brotli compression,…), browser caching optimization, etc. can help us achieve the same. As I had mentioned earlier this step will help with performance improvement. Like in our case, some of these infrastructure level changes were already in place due to earlier attempts to improve page load performance. So we had very little to do in these areas. But if not done already, this step has to be considered for a broader impact across multiple pages/workflows.
Using some of these simple techniques mentioned above, we were able to optimize the network waterfall of some of our core workflows & observed up-to ~30% improvement in our page load times (measured by TP99 metric). Below are the screenshots to show before & after changes to indicate the performance improvement due to the optimization of the network waterfall.
Conclusion
- Having a process to measure, monitor & constantly improvise web page performance by leveraging on newer techniques & capabilities is the only way to deliver awesome customer experiences.
- It is important to solve for connections with high network latency. And if you solve for these outliers and you will be able to easily achieve a better page load performance (measured by TP99 metric).
- Web page load performance optimization includes a varied number of tools and techniques, and it starts to become overwhelming for anyone to remember and apply these techniques. So an alternate way to look at the same is to say “Optimize the network waterfall” (which covers most of the techniques) so that we can easily remember & apply these techniques.
- The time taken to load a specific resource not only depends on the transfer size but also depends on the network latency.
- If we can reduce the number of steps in the network waterfall before the page is successfully loaded, we can achieve better page load performance.
References
[1] Impact on customer/business due to poor performance
• Web Performance: what you don’t know will hurt your customers
[2] Increased focus on performance by browsers, tools & frameworks
• https://web.dev/native-lazy-loading
• https://webpack.js.org/…/code-splitting/#dynamic-imports
• https://webpack.js.org/configuration/performance
• https://developers.google.com/…/performance/webpack
[3] CSS Sprites
https://css-tricks.com/css-sprites/
[4] HTTP2
• The Right Way to Bundle Your Assets for Faster Sites over HTTP/2
• http://engineering.khanacademy.org/…/js-packaging-http2.htm
• https://developers.google.com/…/performance/http2
[5] Native lazy loading support by chrome
• https://web.dev/native-lazy-loading
• https://css-tricks.com/native-lazy-loading
[6] Web Page Test
• https://www.webpagetest.org/
[7] Chrome developer tools
• Network tools
[8] Brotli compression
• Brotli vs Gzip Compression. How we improved our latency by 37%
• Dropbox: Deploying Brotli for static content
[9] PRPL Pattern
• https://web.dev/apply-instant-loading-with-prpl/
[10] RAIL Model
• https://web.dev/rail/
[11] React.Lazy
• https://reactjs.org/docs/code-splitting.html#reactlazy
• https://web.dev/code-splitting-suspense/
[12] Performance metrics
• User-centric performance metrics
[13] Loading & Rendering performance
• https://developers.google.com/…/performance/load-performance
• https://developers.google.com/…/performance/rendering


